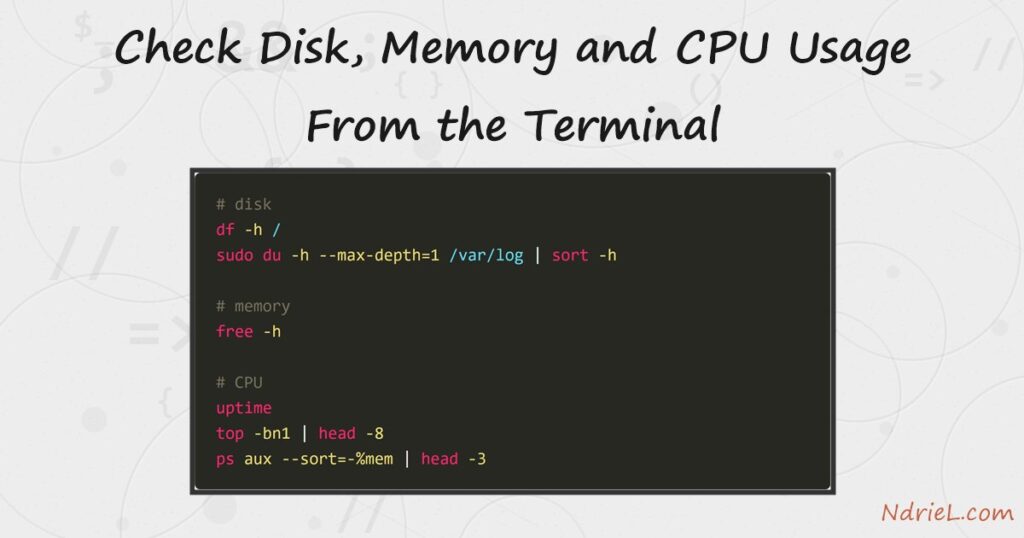
Check disk, memory and CPU usage from the terminal and a slow server stops being a guess. Four commands answer almost every question: df for free space, du for what consumed it, free for memory, and top for the processes. None of them change anything, so all are safe on a live box. First, this tutorial finds the full filesystem. Next, it tracks down the directory responsible. Finally, it reads memory, load average and the worst offending process.
Requirements to check disk, memory and CPU usage:
- A Linux server you can reach over SSH (tested on Ubuntu 24.04.4 LTS, an AWS EC2 instance with 2 vCPUs and 1.8 GB of RAM).
sudofor theduexamples, because parts of /var are not world-readable.- Nothing to install. Every command below ships with the base system, apart from
htop.
How To Check Disk, Memory and CPU Usage.
The objective is a diagnosis in under a minute: which resource is short, and which file or process is to blame. Start with an SSH connection to the server, then work through the four commands in order.
Step 1.
First, ask how much disk is left. The -h flag prints human-readable sizes rather than blocks.
df -hFilesystem Size Used Avail Use% Mounted on
/dev/root 29G 8.0G 21G 29% /
tmpfs 919M 0 919M 0% /dev/shm
tmpfs 368M 956K 367M 1% /run
/dev/nvme0n1p16 891M 149M 680M 18% /boot
/dev/nvme0n1p15 98M 6.4M 92M 7% /boot/efi
tmpfs 184M 12K 184M 1% /run/user/1000Read the Use% column and ignore the tmpfs rows, which live in RAM. Here /dev/root is the real filesystem at 29% of 29 GB. Above 90% you are close to trouble, because a full disk stops MySQL writing and takes the site down.
Step 2.
Next, find what is using the space. df reports the total, whereas du walks a directory and adds up the files inside it.
# one line per directory, largest last
sudo du -h --max-depth=1 /var/log | sort -h
1.8M /var/log/amazon
5.5M /var/log/nginx
6.4M /var/log/sysstat
326M /var/log/journal
374M /var/logThe systemd journal is 326 MB of the 374 MB total, so that is where the space went. Repeat the command one level deeper to narrow it further, or point it at the site itself.
sudo du -h --max-depth=1 /var/www/ndriel.com/httpsdocs | sort -h11M /var/www/ndriel.com/httpsdocs/wp-admin
68M /var/www/ndriel.com/httpsdocs/wp-includes
124M /var/www/ndriel.com/httpsdocs/wp-content
202M /var/www/ndriel.com/httpsdocssort -h is what makes this readable, since it sorts 1.8M before 326M instead of alphabetically. Uploads and logs are the two directories that grow without anyone deciding they should.
Step 3.
Then, look at memory. The numbers confuse everyone the first time, because Linux deliberately spends free memory on cache.
free -h total used free shared buff/cache available
Mem: 1.8Gi 777Mi 178Mi 132Mi 1.2Gi 1.0Gi
Swap: 2.0Gi 76Mi 1.9GiRead the available column, not free. Only 178 MB is genuinely unused, yet 1.0 GB is available, because the 1.2 GB of buff/cache is disk cache the kernel hands back on demand. A low free value is normal and healthy. Watch the swap row instead: 76 MB used here is fine, but a server actively swapping is a server about to crawl.
Step 4.
Now check the CPU. uptime is the fastest answer, and the three load averages cover the last 1, 5 and 15 minutes.
uptime
nproc 01:20:39 up 24 days, 12:47, 1 user, load average: 0.17, 0.06, 0.02
2Load average counts processes waiting to run, so compare it against the core count from nproc. On these 2 cores, 2.0 means fully busy and 0.17 means idle. Therefore a load of 4 on a 4-core box is fine, while the same figure on a 1-core box is a queue.
Step 5.
Finally, name the process. top in batch mode prints one snapshot and exits, which makes it usable over SSH and in scripts.
top -bn1 | head -8top - 01:20:39 up 24 days, 12:47, 1 user, load average: 0.17, 0.06, 0.02
Tasks: 151 total, 1 running, 150 sleeping, 0 stopped, 0 zombie
%Cpu(s): 0.0 us, 0.0 sy, 0.0 ni,100.0 id, 0.0 wa, 0.0 hi, 0.0 si, 0.0 st
MiB Mem : 1836.9 total, 178.9 free, 777.1 used, 1198.9 buff/cache
MiB Swap: 2048.0 total, 1971.7 free, 76.3 used. 1059.8 avail MemThe id figure is idle CPU and wa is time spent waiting on disk. A high wa with low us means the bottleneck is storage, not processing. To rank processes instead, sort ps by memory or CPU.
ps aux --sort=-%mem | head -3USER PID %CPU %MEM VSZ RSS TTY STAT START TIME COMMAND
mysql 510480 0.0 11.4 1576460 216204 ? Ssl Aug01 11:22 /usr/sbin/mariadbd
nd-web 1032726 4.0 4.3 263896 82024 ? S 01:20 0:00 php-fpm: pool ndrielSwap -%mem for -%cpu to rank by processor time instead. For a live, colour-coded view there is htop (3.3.0 here), though it is interactive and needs a real terminal.
Result when you check disk, memory and CPU usage.
Four commands, four answers, and no changes to the server. This is the real output from the ndriel.com production box:
ubuntu@ip-172-31-20-62:~$ df -h /
Filesystem Size Used Avail Use% Mounted on
/dev/root 29G 8.0G 21G 29% /
ubuntu@ip-172-31-20-62:~$ sudo du -h --max-depth=1 /var/log | sort -h | tail -3
6.4M /var/log/sysstat
326M /var/log/journal
374M /var/log
ubuntu@ip-172-31-20-62:~$ free -h
               total        used        free      shared  buff/cache   available
Mem:           1.8Gi       777Mi       178Mi       132Mi       1.2Gi       1.0Gi
Swap:          2.0Gi        76Mi       1.9Gi
ubuntu@ip-172-31-20-62:~$ uptime
01:20:39 up 24 days, 12:47, 1 user, load average: 0.17, 0.06, 0.02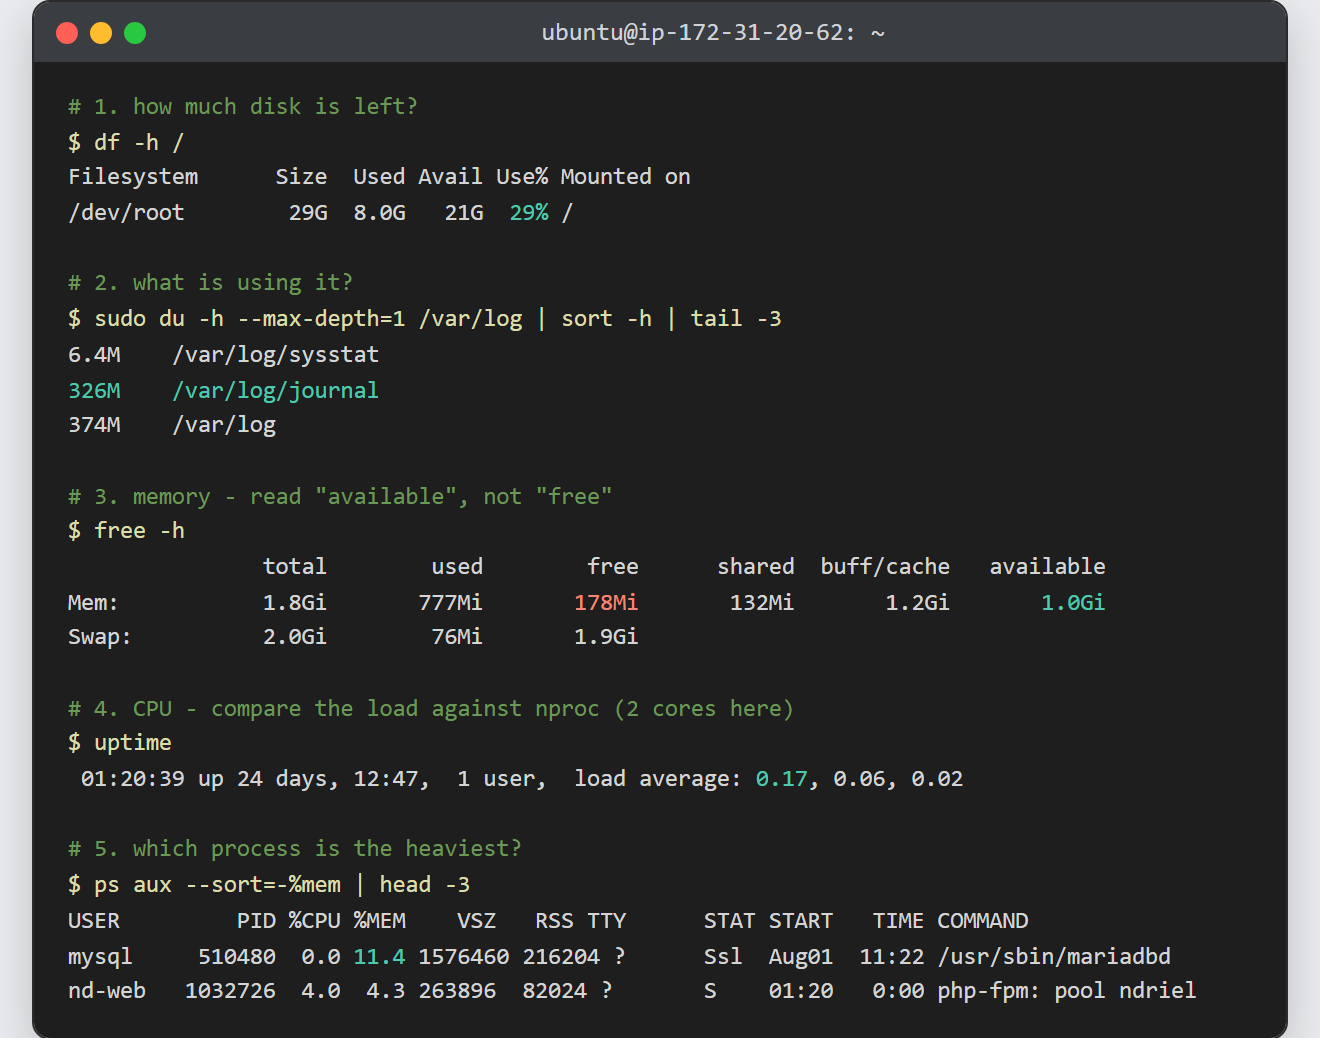
Notes on how to check disk, memory and CPU usage:
- A disk can fill without filling.
df -hmay show space free while writes still fail, because the filesystem ran out of inodes instead. Check that withdf -i, which usually points at a directory holding millions of tiny files. - Deleting a file a process still has open frees nothing. The space returns when that process closes the handle or restarts, and
sudo lsof +L1lists the culprits. - An oversized journal is capped, not deleted.
sudo journalctl --vacuum-size=100Mtrims it immediately, andSystemMaxUse=100Min /etc/systemd/journald.conf keeps it there. - Application logs grow forever unless something rotates them, which is what a scheduled cron job is usually doing on a healthy server.
- A one-off snapshot hides spikes.
vmstat 5orsar -ushows a trend, and the trend is what tells you whether the server needs more memory or just a restart. - Memory pressure often surfaces as a dead PHP worker rather than an error. If a systemd service keeps restarting, check available memory before assuming the service is at fault.