Analyze Apache access logs from the terminal and questions like “who hits this server hardest?” take one line to answer. No dashboard, no agent — just awk, sort, uniq and grep, which every Linux box already has. First, this tutorial decodes the log format. Next, it builds one ranking pipeline and reuses it for top IPs, top URLs and status codes. Finally, it slices the log by time and hunts down the 404s.
Requirements to analyze Apache access logs:
- Any Linux shell with GNU coreutils (tested with GNU Awk 5.2.1 on Ubuntu 24.04.4 LTS). macOS and Git Bash work identically.
- An access log in the standard combined format — Apache writes /var/log/apache2/access.log; nginx’s default format is the same, at /var/log/nginx/access.log.
- The examples use /tmp/a70/access.log, seeded with 46 sample entries that use documentation IP ranges, so no real visitor appears in the output. Every pipeline runs unchanged on your real log.
How To Analyze Apache Access Logs From the Terminal.
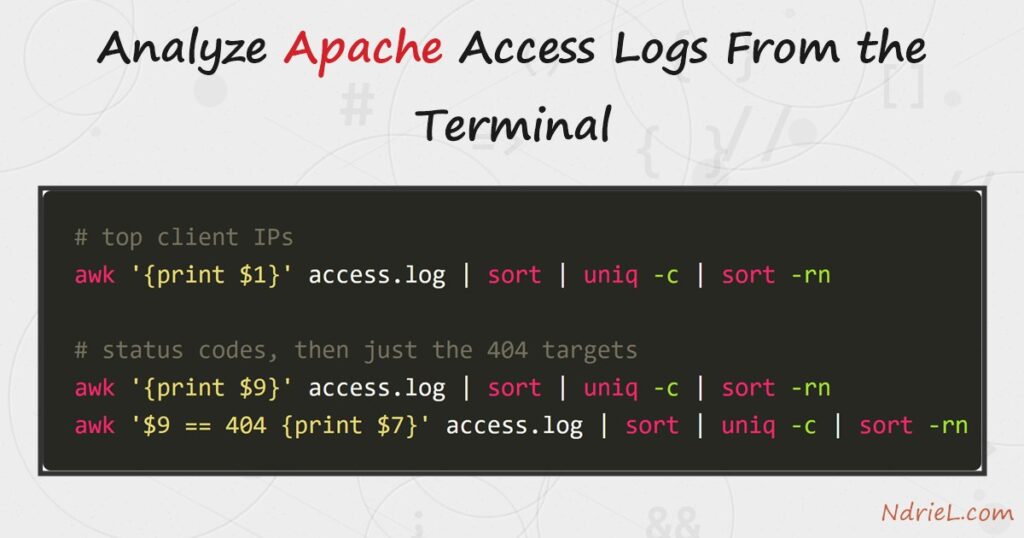
The objective is a handful of pipelines you can type from memory during an incident. All of them stand on one idea: pick a column with awk, then count with sort | uniq -c | sort -rn.
Step 1.
First, know what a line contains. Look at the top of the log:
head -3 access.log203.0.113.42 - - [16/Aug/2026:06:04:11 +0000] "GET / HTTP/1.1" 200 5321 "-" "Mozilla/5.0 (compatible; ExampleBot/2.1; +http://example.com/bot)"
203.0.113.42 - - [16/Aug/2026:06:04:12 +0000] "GET /css/style.css HTTP/1.1" 200 1284 "http://demo-site.test/" "Mozilla/5.0 (compatible; ExampleBot/2.1; +http://example.com/bot)"
203.0.113.42 - - [16/Aug/2026:06:04:13 +0000] "GET /favicon.ico HTTP/1.1" 200 941 "-" "Mozilla/5.0 (compatible; ExampleBot/2.1; +http://example.com/bot)"awk splits each line on whitespace into numbered fields. For the combined format, three matter here: $1 is the client IP, $7 is the requested URL, and $9 is the status code.
Step 2.
Next, the workhorse — top talkers. Print the IP column, group identical lines, count them, and rank.
awk '{print $1}' access.log | sort | uniq -c | sort -rn 15 203.0.113.42
8 198.51.100.7
7 192.0.2.25
6 203.0.113.9
4 198.51.100.61
3 192.0.2.148
2 203.0.113.77
1 198.51.100.23Each stage earns its place: sort brings duplicates together, because uniq -c only counts adjacent identical lines, and the final sort -rn orders the counts numerically, largest first. One address made a third of all requests — grep for it and its user agent says ExampleBot/2.1: a crawler, not a person.
Step 3.
The same pipeline answers “what do they ask for?” — only the column changes. Add head to keep the top of a long list.
awk '{print $7}' access.log | sort | uniq -c | sort -rn | head 13 /
8 /blog/
5 /blog/deploy-a-site-with-rsync/
4 /favicon.ico
4 /css/style.css
4 /contact/
      3 /wp-login.php
      2 /old-page/
2 /blog/feed/
1 /admin/The busiest page after the front page is, fittingly, the post about deploying a site with rsync from earlier in this series. But /wp-login.php on a site with no WordPress is a probe — worth watching.
Step 4.
Then, take the server’s temperature by status code, and follow up on the errors. awk can also filter: $9 == 404 keeps only the misses.
awk '{print $9}' access.log | sort | uniq -c | sort -rn 37 200
5 404
2 301
1 500
1 403awk '$9 == 404 {print $7}' access.log | sort | uniq -c | sort -rn 3 /wp-login.php
2 /old-page/The 404s split cleanly: /wp-login.php is the probe again, while /old-page/ is a real URL that vanished — a redirect candidate. The lone 500 deserves a matching look at the error log.
Step 5.
Finally, narrow by time. The timestamp is plain text, so grep slices any hour, then a projection shows who did what.
grep '16/Aug/2026:13' access.log | awk '{print $1, $7, $9}'203.0.113.9 /contact/ 200
198.51.100.61 /blog/deploy-a-site-with-rsync/ 200
203.0.113.42 / 500
192.0.2.25 /favicon.ico 200
198.51.100.7 / 200There is the 500, caught at 13:33 — with the IP that triggered it. For a live view during an incident, tail -f access.log streams new requests as they land; pipe it through the same awk filters to watch one IP or one status in real time.
The result when you analyze Apache access logs.
Four pipelines, one pattern — column, sort, count, rank — and the log answers who, what, how well, and when.
     15 203.0.113.42        37 200
      8 198.51.100.7         5 404
      7 192.0.2.25           2 301
      6 203.0.113.9          1 500
      4 198.51.100.61        1 403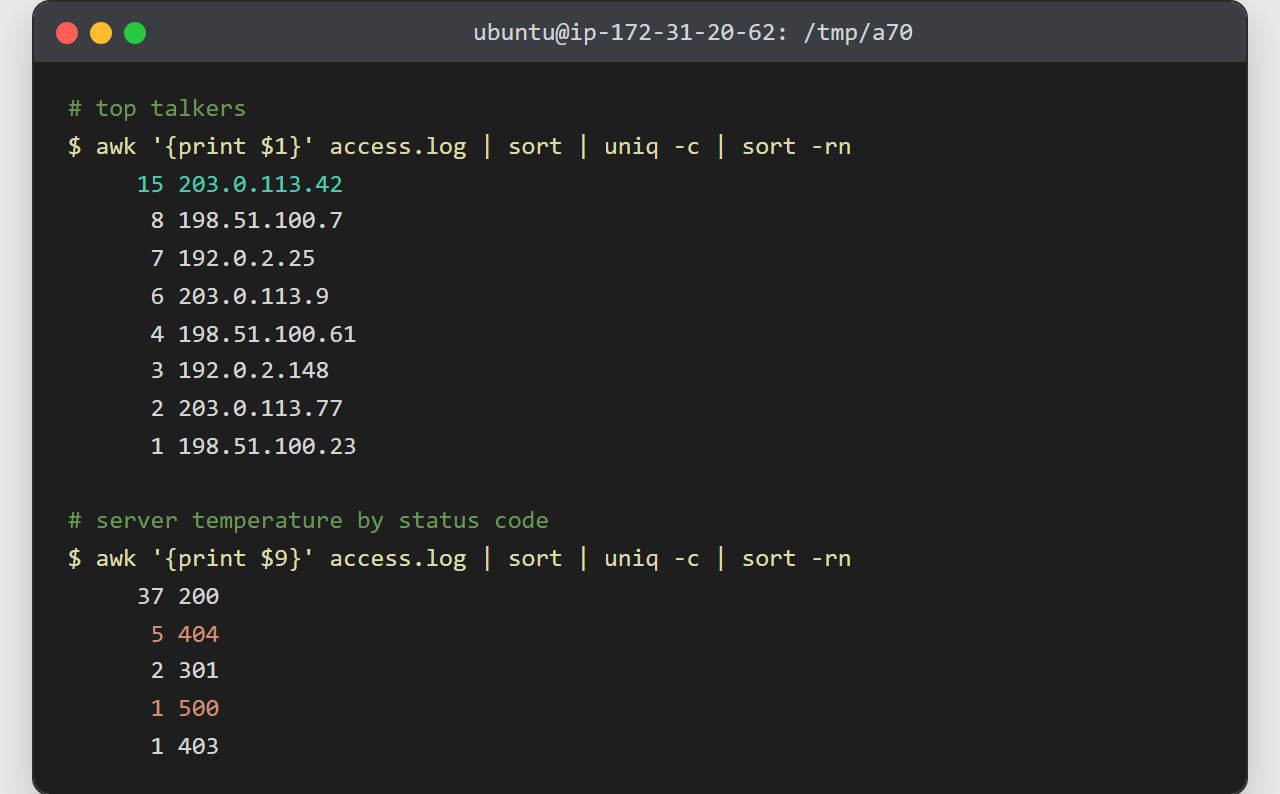
Notes when you analyze Apache access logs:
- These pipelines read the file in place and change nothing, so they are safe on a production log at any time.
- Rotated archives still count:
zcat access.log.*.gz | awk '{print $1}' | sort | uniq -c | sort -rnanalyzes them without extracting. Rotating logs with logrotate is what keeps those files small enough to scan in the first place. - If your LogFormat adds a leading field (a virtual-host name is common), every column shifts by one — check with
head -1before trusting$9. - Counting requests is not counting people. One crawler out-requested every human visitor here; filter by user agent before drawing traffic conclusions.